150x150.png)

Designing efficient traffic signal installations requires more than simply applying software outputs. While modern modelling tools are extremely powerful, it is essential for designers and engineers to understand the principles that sit behind the calculations. Saturation and capacity are two of the most important concepts in traffic signal design, as they directly determine how well a junction can accommodate traffic demand.
This article explains the first principles behind saturation flow, capacity, and related parameters used in signal design. Although these calculations are often carried out using specialist software such as Linsig, a solid grounding in the fundamentals helps ensure models are set up correctly and interpreted with confidence.
Before a traffic signal installation can be designed or modified, it is essential to understand the nature and scale of traffic demand at the junction. This is typically achieved through a traffic survey, which records the number of vehicles using each movement through the junction at different times of day.
To understand not just how much traffic is present, but also where it is going, surveys are often used to produce an Origin–Destination (OD) matrix. This allows designers to see how flows change across the junction and how traffic patterns vary throughout the day, which is critical when assessing peak demand conditions.
Traffic surveys usually classify vehicles into types such as cars, vans, heavy goods vehicles, buses, motorcycles, and cycles. Because different vehicle types occupy different amounts of road space and behave differently in traffic, raw vehicle counts are not suitable for capacity calculations.
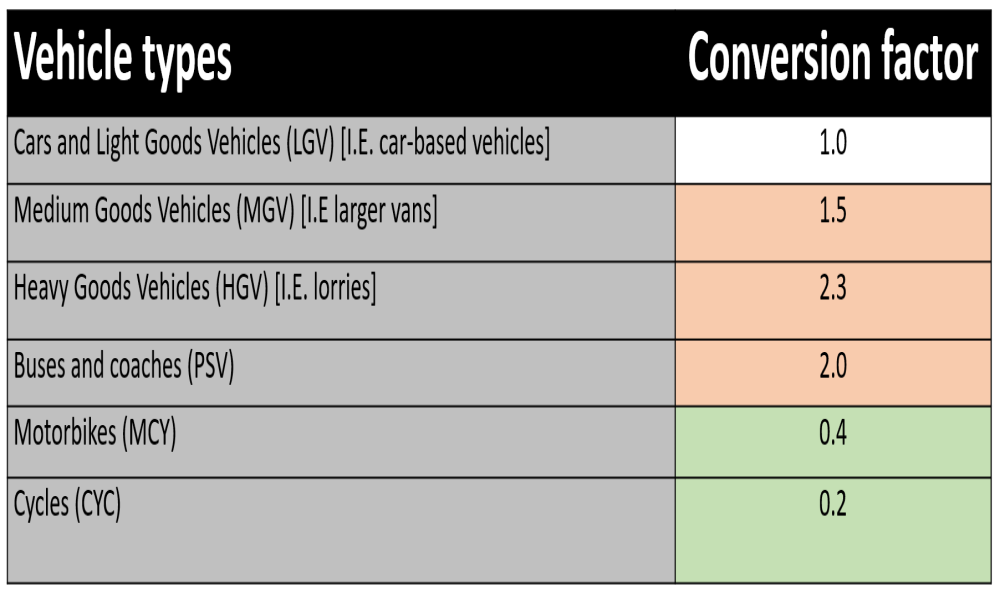
To address this, classified counts are converted into Passenger Car Units (PCUs). A PCU represents a nominal vehicle length of 5.75 metres, allowing all traffic to be expressed in a common unit. Larger vehicles such as buses and HGVs are assigned higher PCU values, while smaller vehicles such as motorcycles are assigned lower values.
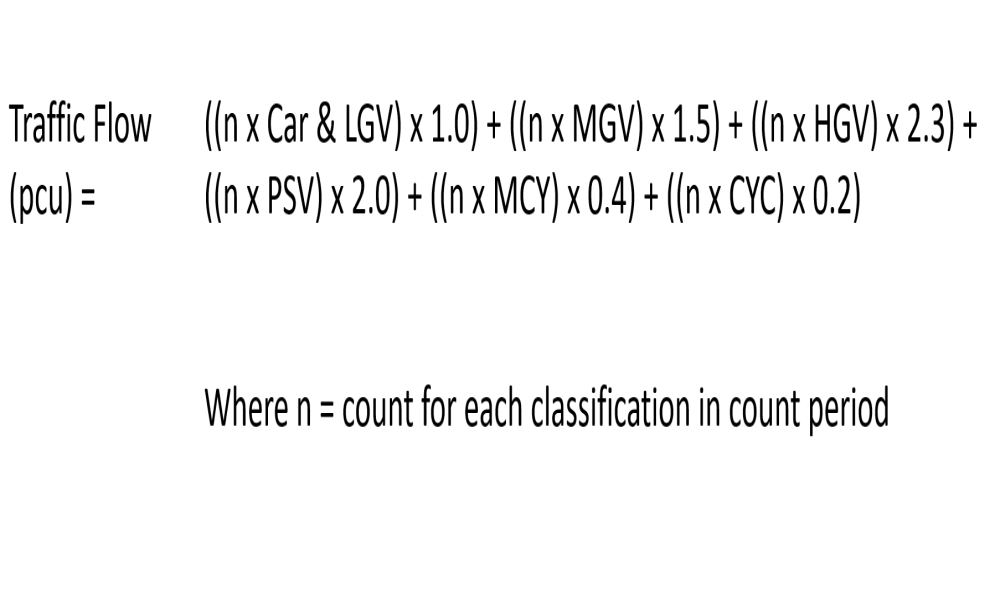
Traffic flow is then expressed in PCUs per hour rather than vehicles per hour. Survey data collected in shorter intervals, typically 15 minutes, is aggregated and converted to hourly PCU flows for use in subsequent calculations.
Once traffic demand is known, the next step is to understand how much traffic the junction can accommodate. This is where saturation flow becomes critical. Saturation flow is the theoretical maximum rate at which traffic can pass through a single lane, expressed in PCUs per hour, assuming it receives a continuous green signal.
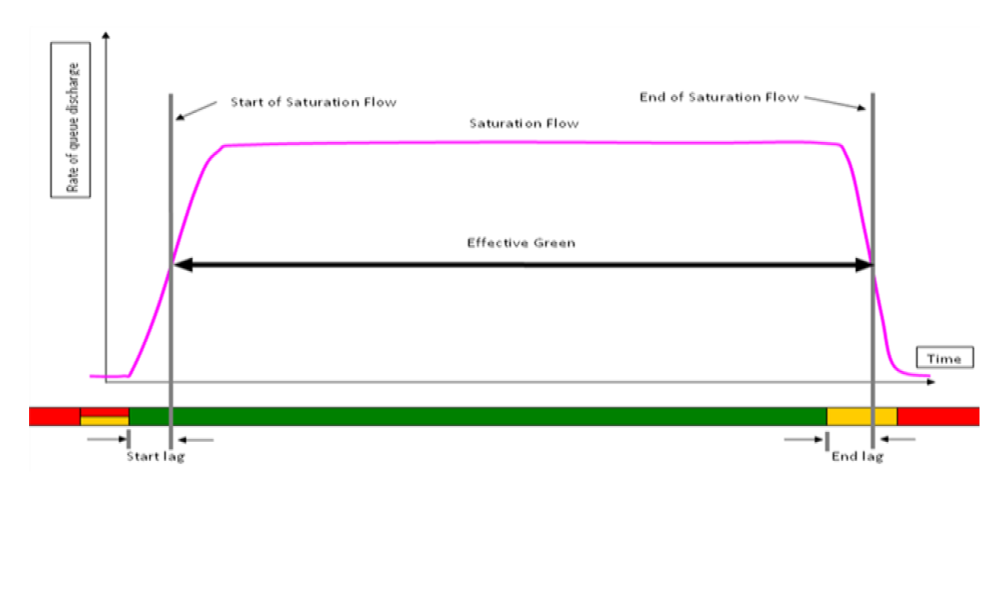
At the start of a green signal, vehicles take time to react and accelerate, resulting in a lower initial discharge rate. After a short period, traffic reaches a steady flow rate known as the saturation flow. Although this rate cannot be sustained indefinitely in practice, it provides a useful benchmark for design.
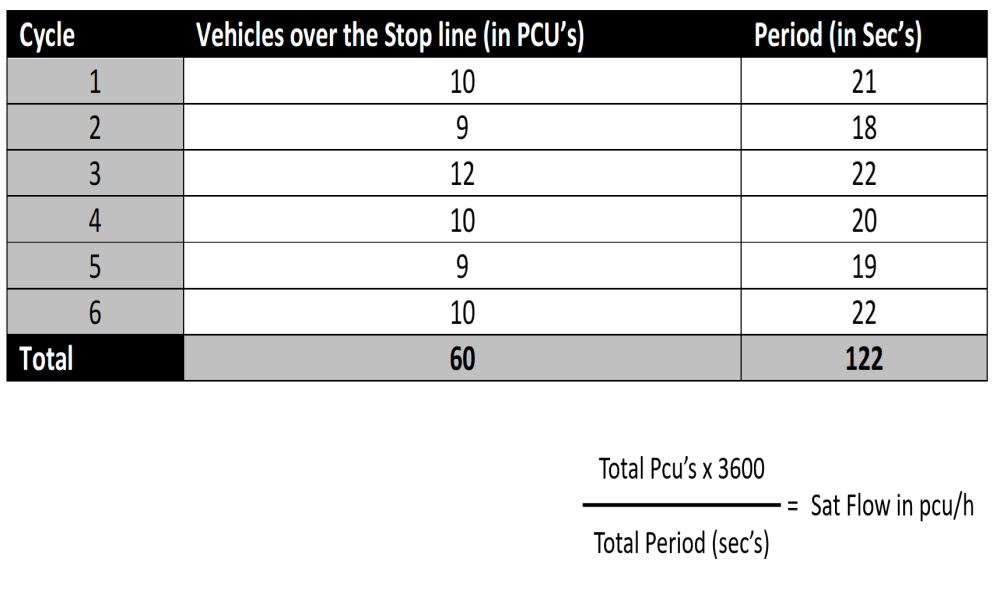
At existing junctions, the preferred method for determining saturation flow is direct measurement. This involves observing a saturated queue and counting the number of PCUs that cross the stop line over a measured time period, excluding the initial starting lag at the beginning of the green signal.
Where direct measurement is not possible, saturation flow can be estimated. A theoretical maximum value of 2080 PCU per hour is commonly used for a single unopposed lane. In practice, conservative values such as 1900 PCU per hour for straight-ahead movements, or 1800 PCU per hour for turning movements, are often applied.
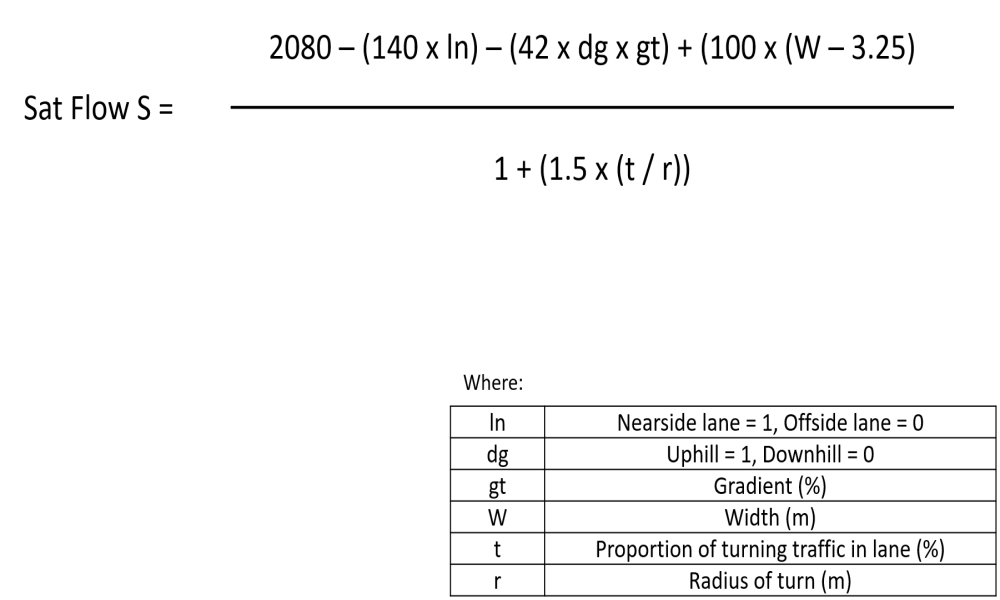
Saturation flow can also be calculated using formulae that take account of lane characteristics such as width, gradient, lane position, and the proportion and radius of turning movements. These adjustments reflect the way geometry and driver behaviour influence traffic discharge rates.
Not all of the displayed green time at a signal is equally effective in moving traffic. Due to driver reaction times and vehicle dynamics, there is a starting lag at the beginning of green. Conversely, drivers often continue to discharge traffic into the amber period, resulting in an end gain.
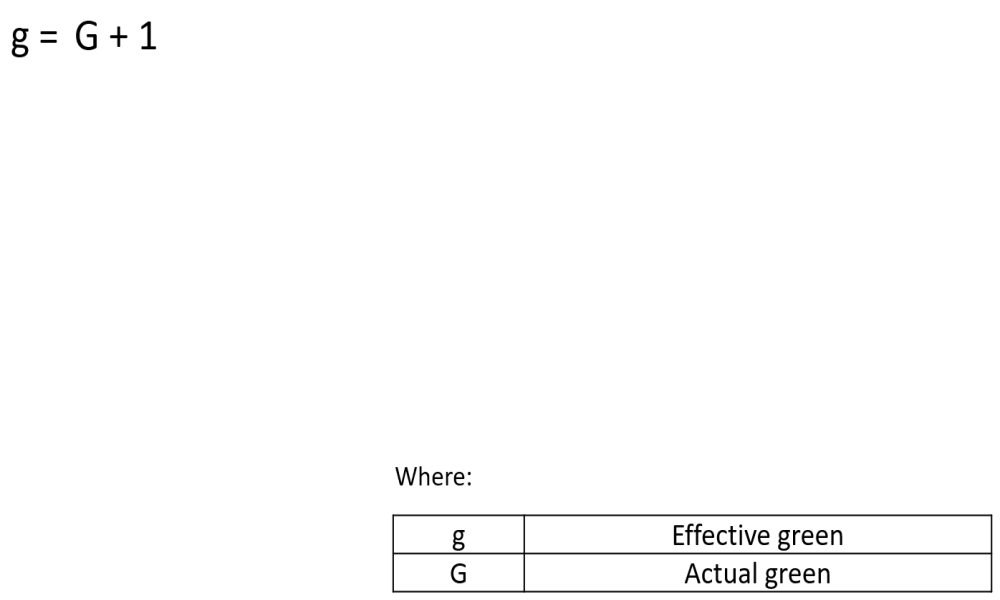
To account for this, the concept of effective green time is used. In simple terms, effective green is taken as the actual green time plus one second. This adjusted value is used in capacity calculations instead of the displayed green time.
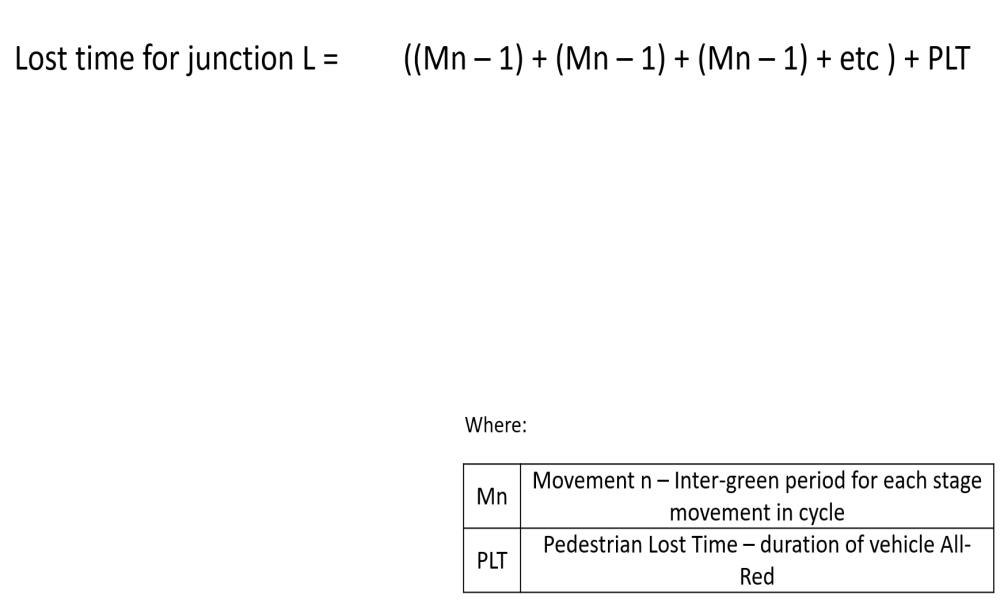
Lost time represents periods within the signal cycle when traffic is not discharging. This includes inter-stage periods between signal phases and any all-red periods, such as those associated with pedestrian stages. Lost time has a direct impact on overall junction capacity and must be carefully accounted for.
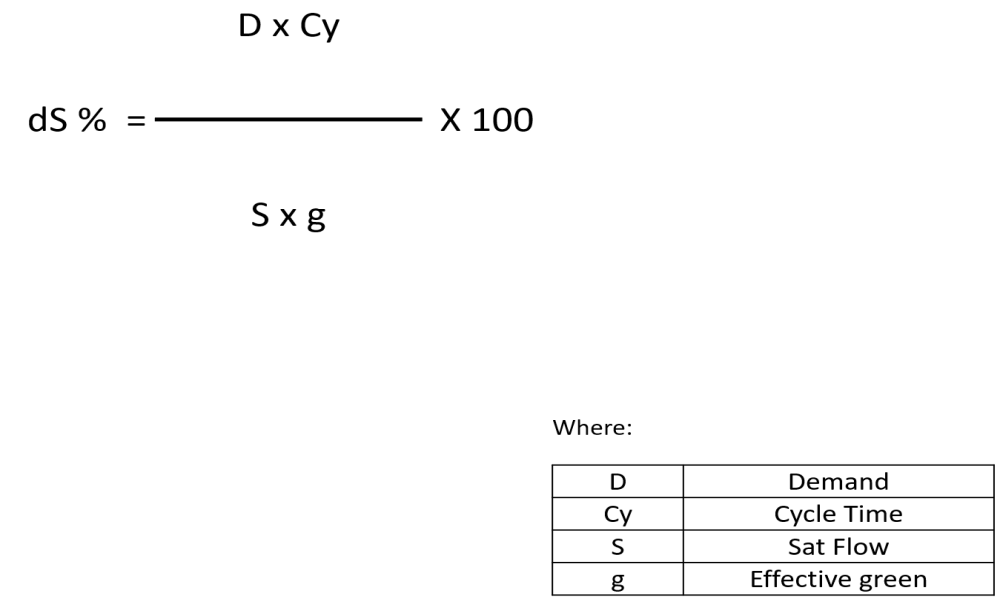
The degree of saturation is a key performance measure for signalised junctions. It represents the ratio of traffic demand to available capacity for a given lane or movement. A degree of saturation close to or above 100% indicates that demand exceeds capacity, leading to queues and delays.
In practice, traffic flow is variable and does not arrive uniformly. To allow for this variability, good design practice limits the degree of saturation to around 90%. This provides a margin that helps ensure efficient operation under real-world conditions.
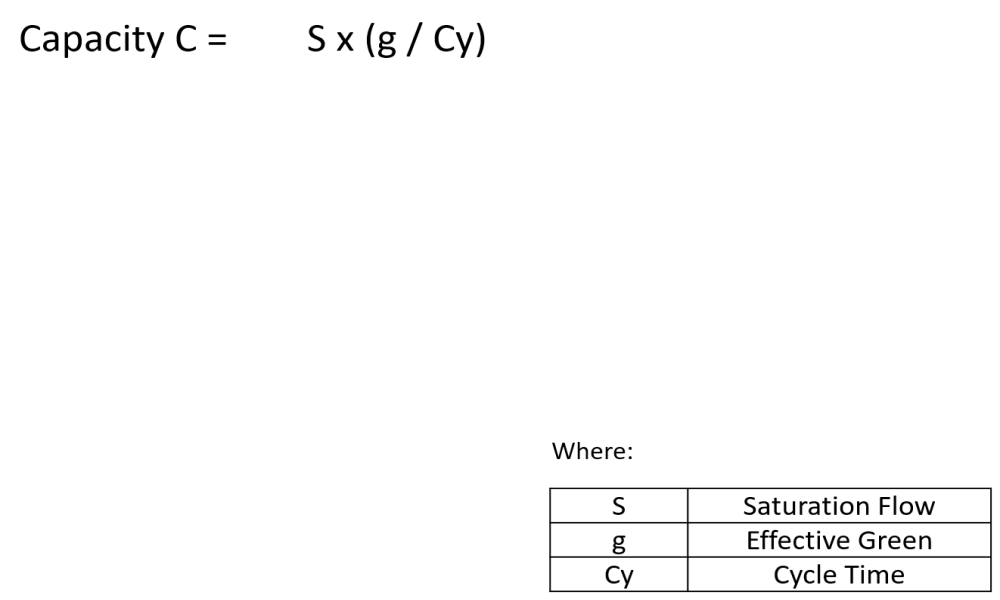
Capacity differs from saturation flow in that it reflects how the signals actually operate. Capacity is calculated by multiplying the saturation flow by the ratio of effective green time to cycle time. This produces a capacity value in PCUs per hour for a specific lane.
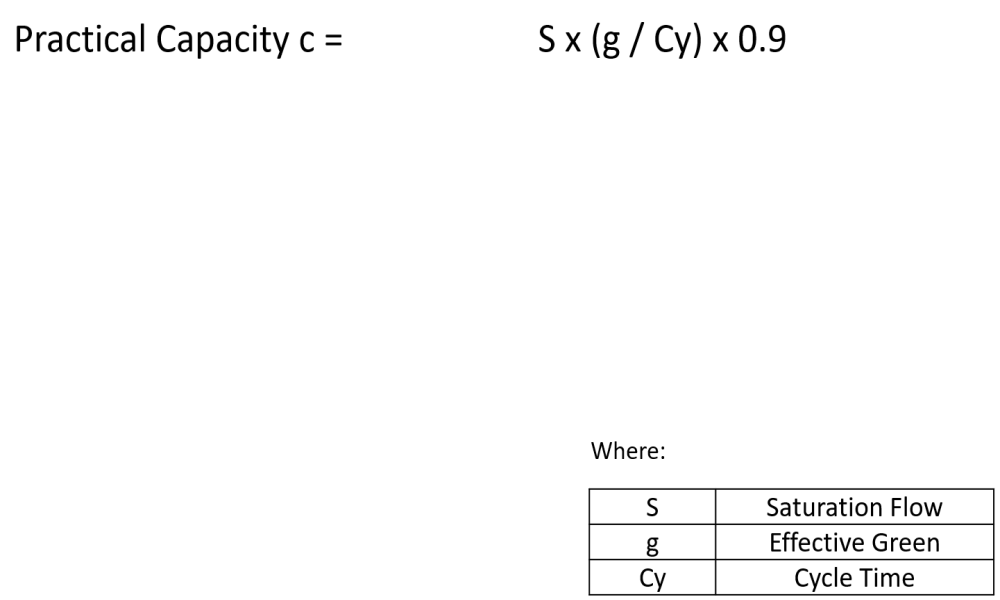
Practical capacity further refines this value by applying the 90% design threshold. This represents the level of flow that can be accommodated while still maintaining acceptable performance and resilience to fluctuations in demand.
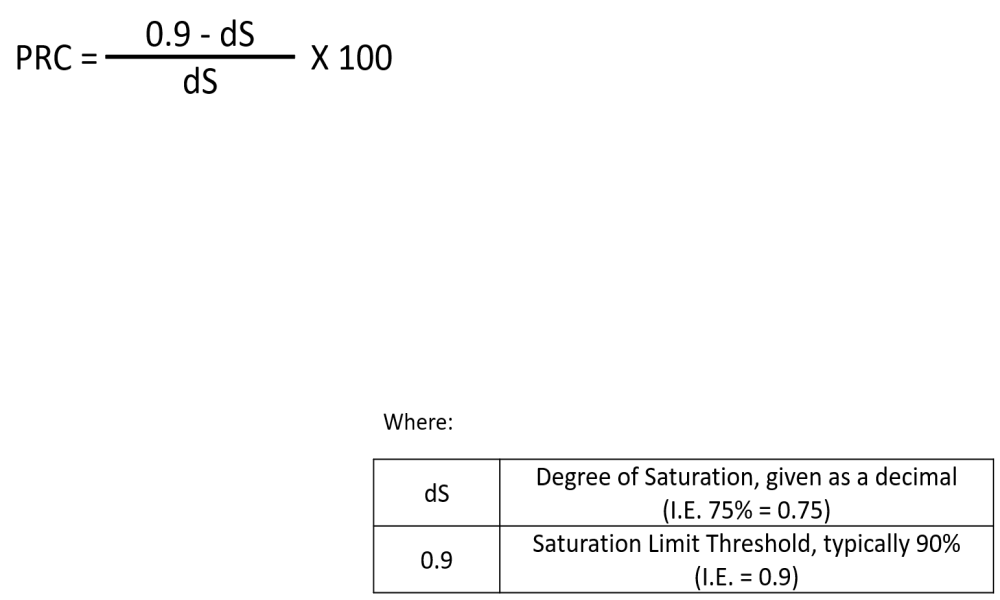
Practical Reserve Capacity (PRC) provides an indication of how much spare capacity remains in the system. It is derived from the degree of saturation and expressed as a percentage for a given cycle time. Low or negative PRC values indicate that a junction is operating close to, or beyond, its practical limit.
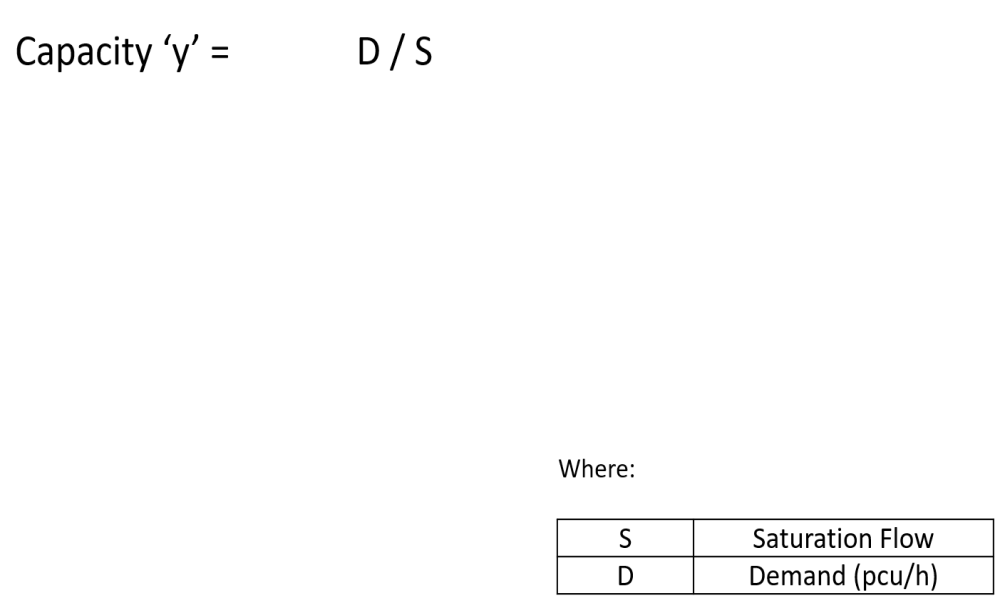
Another important set of parameters are the ‘y’ and ‘Y’ values. Small ‘y’ values represent the ratio of demand to saturation flow for individual stages, helping to identify critical movements. The overall ‘Y’ value combines these with lost time to assess whether the proposed signal operation is viable.
Although software tools can automate many of these calculations, they are only as good as the assumptions and inputs provided. Understanding saturation, capacity, and related concepts from first principles allows designers to diagnose problems, test alternatives, and make informed decisions.
By mastering these fundamentals, traffic engineers can ensure that signalised junctions operate efficiently, safely, and reliably — both on the computer screen and on the street.
To find out lots more about traffic signal principles, try watching our video about Saturation and Capacity on the @ITSNow YouTube Channel -Click the buttons below to see more articles:
See all ArticlesIndustry InsightEventsITS Thought LeadershipITS Educational